Decoding Human Psychology Involved with Money. Real time AI training for Aster (DEX)
WATCH TRAINING LIVE BELOW ⬇︎
About Aister
This text is NOT AI generated: Welcome to Aister, our AI-driven system designed to decode human psychology involved with money. Using historical price data and unique Fibonacci levels, Aister analyzes market structure and volume dynamics to identify high-probability trading setups.
The images you see above are visualizations of what the training process is doing internally. They show how the AI interprets historical price movements and Fibonacci patterns, helping it learn which market structures, combined with volume deltas, are likely to produce successful trades.
1. How Aister Works
Data Processing: We use detailed historical price data (CSV format) for analysis. The AI studies patterns over many time windows, focusing on 7 unique Fibonacci numbers.
Training Phase: Aister identifies market behavior patterns that correlate with profitable setups. During training, the AI evaluates price levels, trend directions, and volume deltas. The system does not overfit; it generalizes patterns across the dataset to avoid tailoring decisions only to past data.
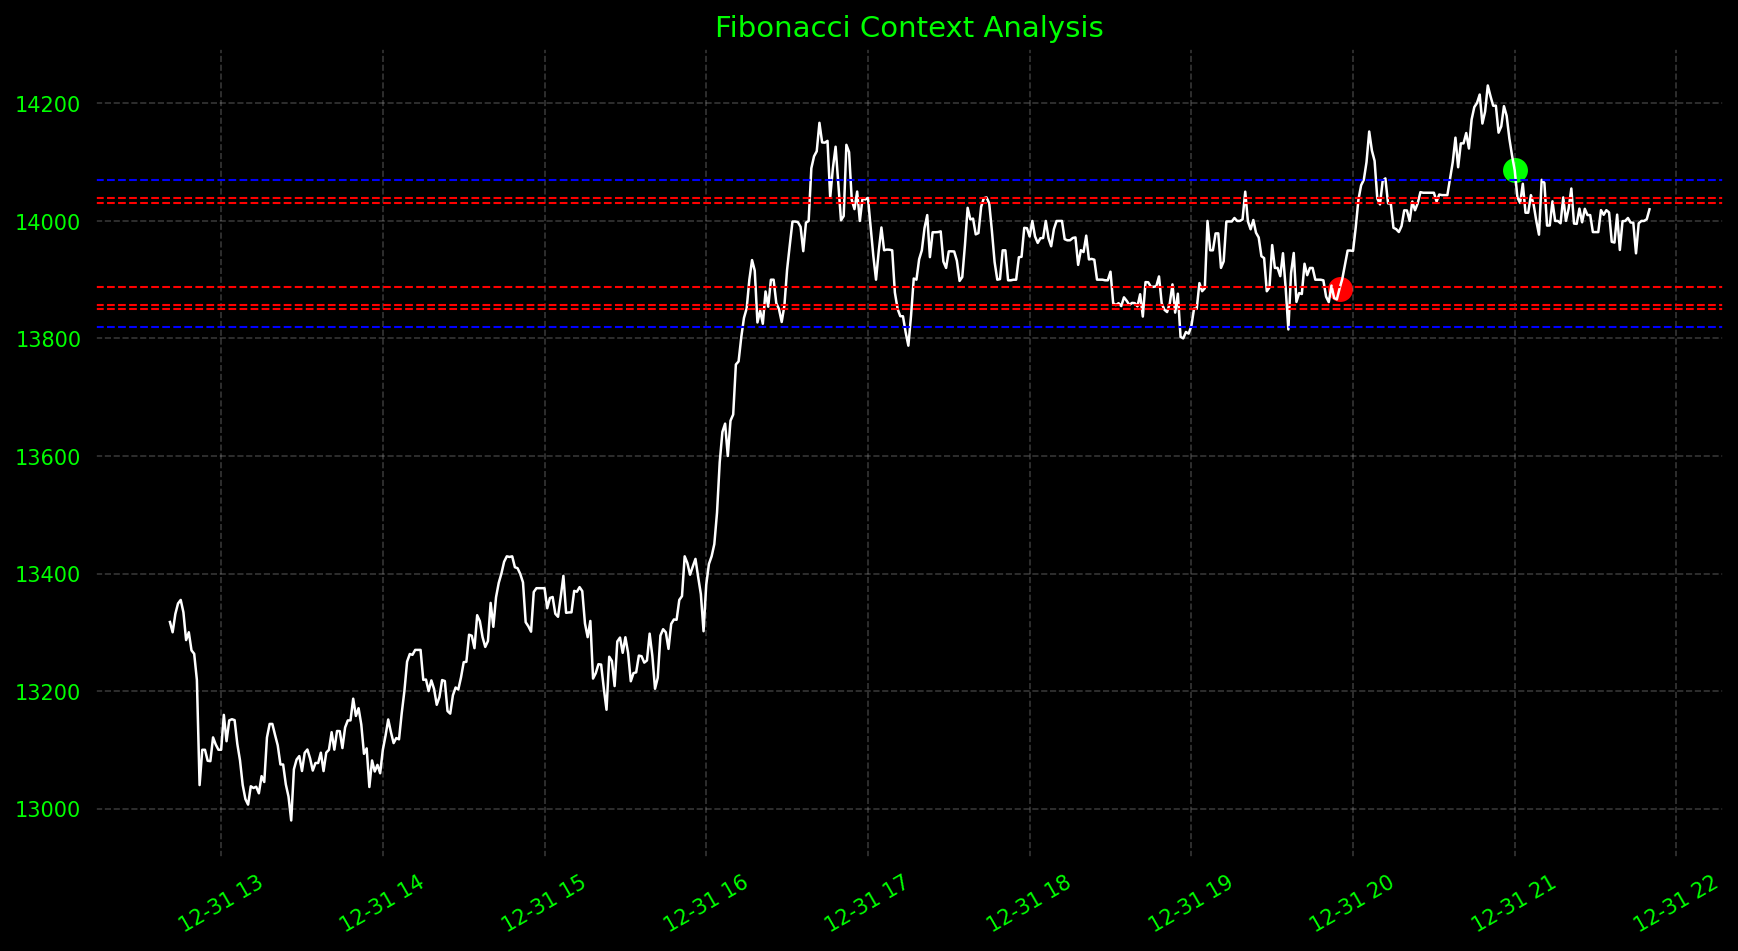
Visualization of Learning: Each snapshot PNG you see is a visual representation of a segment of historical data. It shows Fibonacci levels, price action, and entry/exit evaluations—helping us verify that the AI’s logic aligns with market structure. These images are not trades themselves—they are tools for understanding the AI’s learning process.
Market Evaluation: Based on its training, Aister can identify promising structures in live markets. It assesses where trends are likely to continue or reverse based on the historical patterns and volume deltas it has learned.
2. Key Concepts
Unique Fibonacci Numbers: Non-standard ratios are used to capture subtle market behaviors.
Volume Delta: Evaluates buying/selling pressure at each price level to determine potential strength of moves.
Avoiding Overfitting: The AI generalizes across multiple patterns and time windows, ensuring it does not memorize the past but learns predictive features.
3. Why You See These Images
Every PNG snapshot above is a window into the AI’s evaluation process. They represent segments of historical data with the AI’s analysis overlaid, helping us understand which structures the AI identifies as high-probability setups. Think of them as insights into the AI’s reasoning, not actual trades. Images are potentially stored from previous training cycles because saving these context snapshots to the website will make it lag. Refreshing the website will bring you back to Snapshot_001.
4. Conclusion
Aister combines AI intelligence with Fibonacci-based market analysis to decode how traders behave in real-world conditions. The snapshots you see are proof of the AI learning process: a visual insight into how market structure, trend, and volume data guide its evaluation. This ensures visitors can see Aister “thinking” without needing to understand the technical details or replicate the system.